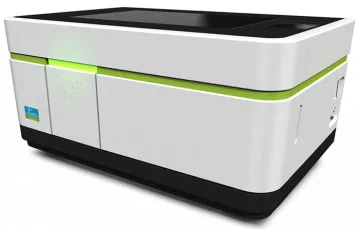
The Operetta CLS high-content analysis system has all the speed, sensitivity and resolution you need to characterize fine sub-cellular details . The Operetta is designed for fully-automated high-capacity, quantitative cellular analysis of fixed or live cells. It contains the highly sensitive sCMOS camera that provides a large field of view and high resolution image capture. The Operetta's Harmony software lets you find even subtle phenotypic changes.
Features and Benefits:
- Objectives
- 5x Air Objective: NA 0.16, WD 12.1 mm (field of view: approx. 2583 μm x 2583 μm)
- 10x Air Objective: NA 0.3, WD 5.2 mm (field of view: approx. 1292 μm x1292 μm)
- 20x Air Objective: NA 0.4, WD 8.28 mm (field of view: approx. 646 μm x 646 μm)
- 20x Water Immersion Objective: NA 1.0, WD 1.7 mm (field of view: approx. 646 μm x 646 μm)
- 40x Water Immersion Objective: NA 1.1, WD 0.62 mm (field of view: approx. 323 μm x 323 μm)
- 63x Water Immersion Objective: NA 1.15, WD 0.6 mm (field of view: approx. 205 μm x 205 μm)
- 4.7Mpx sCMOS camera (2160x2160), 16 bit resolution, 6.5um pixel size
- Motorized 6 position objective turret with 3 air and 3 water immersion objectives
- High resolution, linear drive scanning stage
- High speed precision laser autofocus
- Transmitted light unit (LED: 740nm) for Brightfield and Digital Phase Contrast imaging
- Emission filters:
- 430-500 nm
- 470-515 nm
- 500-550 nm
- 525-580 nm
- 570-650 nm
- 655-760 nm
- Spinning Disk enables optical sectioning
- Confocal imaging improves optical resolution and contrast
- Pinhole disk reduces out-of-focus light
- The LED light engine is equipped with 8 high power LEDs with the following excitation wavelengths:
- 355-385 nm
- 390-420 nm
- 435-460 nm
- 460-490 nm
- 490-515 nm
- 530-560 nm
- 615-645 nm
- 650-675 nm
- Environmental Controls: Sample chamber fitted with temperature and CO2 control to enable live cell experiments.
- Temperature can be controlled between 37°C - 42°C
- CO2 concentration can be controlled between 1-10%
Tips & tools for data collection and interpretation:
Revvity’s Harmony software is used to acquire images on the Operetta CLS high-content fluorescent microscope and can also be used to create custom automated image analysis methods.
Revvity has an interactive fluorescence modeling tool that enables you to select the excitation LEDs and your possible emission spectral wavelengths to help construct an effective assay.
Harmony, like most automated image analysis software, requires the use of fluorescent dyes, antibodies, or expressed proteins to tag the nucleus and/or the cytoplasm to differentiate separate regions of interest from background. To use "image segmentation" to identify cells and cell compartments, fluorescent channels are a critical starting point for all analysis methods to ensure successful image acquisition, and to allow for the creation of robust data analysis methods. Bright field cannot be used to perform image segmentation within the Harmony software.
Recommended dyes for fixed cell assays:
- Hoechst: DNA/Nuclei stain (available in the FGC)
- Ex/Em: 361/497 nm
- Phalloidin: Cytoskeleton/ ECM stain (available in the FGC)
- Available in multiple fluorophores (350,405,555, and 647)
- DAPI (4′,6-diamidino-2-phenylindole): DNA/Nuclei stain
- Ex/Em: 350/470 nm
Recommended dyes for live cell assays:
- Hoechst: DNA/Nuclei stain (available in the FGC)
- Ex/Em: 361/497 nm
- DAPI (4′,6-diamidino-2-phenylindole): DNA/Nuclei stain
- Ex/Em: 350/470 nm
- More options for live cell staining:
Additional resources for assay design:
LifeTech Fluorescence SpectraViewer
BD Biosciences Spectrum Viewer
Issues with culturing cells in 96-well plates
The edge effect: A global problem. The trouble with culturing cells in 96-well plates